Even before the introduction of Dukane’s servo-driven welder, the need for velocity control was recognized. As Mikell Knights wrote in 2005, “Research has proven that consistency of melting rate has a direct influence on bond strength,” A linear velocity means a steady melt rate which, in turn, creates a homogenous molecular structure and a stronger weld [A].
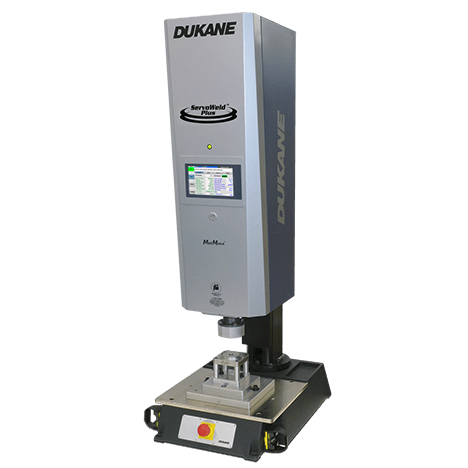
In past years there has been much effort put into attempting to get consistent velocity control with pneumatic systems [2, 3]. These efforts have been in vain, as it is simply not possible to get precise velocity control with a pneumatic welder [C]. As one writer put it, “trying to achieve precise speed control with a pneumatic press was ‘the equivalent of sending a ship on an ocean voyage with a map and a compass from a box of cereal. ” [B]. Dukane’s servo-driven ultrasonic welder offers clear improvement in process control.
Studies using servo ultrasonic welders have shown that the programmed weld velocity can be directly correlated with weld strength [C, D, E, F]. In a study at The Ohio State University it was shown that by using a defined velocity profile with a slower speed during melt initiation and a faster speed in the middle and end of the weld, strength could be increased with less weld time and reduced surface marking [F]. Dukane has provided a unique new weld control to achieve this initiation of melt before collapsing the weld through the use of the patented “melt detect” feature. This feature allows the press to contact the parts and turn on ultrasonic vibration with no vertical movement until a drop in force is detected which indicates that welding has been initiated [C].
Experimentation
One of the greatest benefits of servo-driven ultrasonic welding is the ability to program a specific weld velocity. It has often been said of plastic welding that it is more art than science. With the new controls available, this no longer needs to be the case. In this experiment, we made both a finite element model and a finite difference model of a shear joint in a standard AWS I-Beam sample to determine the rate of melt formation and then welded parts at varying weld velocities to determine if the modeled weld velocity could be correlated to the optimum weld velocity through experimental data.
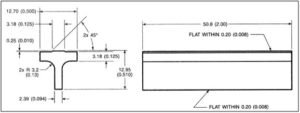 |
| Figure 1: Drawing of AWS I-Beam with Shear Joint [12] |
For the Finite Element Analysis, a ProE 3D CAD model was made of the AWS I-Beam part consisting of three individual pieces, the top part, the bottom part, and the shear joint. The shear joint was assigned a heat generation rate based on the following equation: Q = πƒ•ε²•Eloss, where ε² is the strain amplitude at the shear joint calculated by amplitude divided by length. Eloss is the loss modulus of the material (Nylon 6,6 in this case).
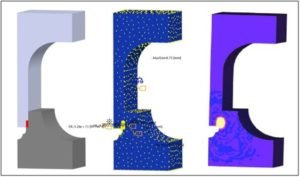 |
| Figure 2: Screenshots of finite element analysis (modeling half of the part) |
The finite difference analysis was performed with the same initial steps. However, instead of using a CAD model, Mathcad was used for the 1D analysis.
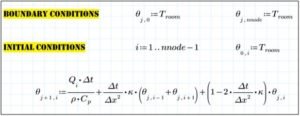 |
| Figure 3: Screenshot of 1D finite difference analysis |
Both methods were used to produce a graph of temperature vs. distance at discrete 0.05 second intervals. The width of the melt layer was determined based on attainment of the melting temperature (354 °C). From this, the rate of melt formation was calculated.
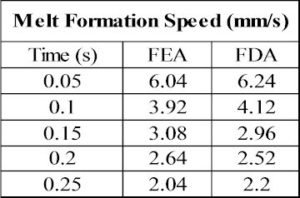 |
| Table 1: Calculated melt formation rates for Finite Element Analysis (FEA) and Finite Difference Analysis (FDA). |
After determining the theoretical ideal welding velocity to match the melt formation, five parts were welded at each of five velocities: 0.5 mm/s, 2 mm/s, 4 mm/s, 6 mm/s, and 10 mm/s. After the parts were welded, they were cut in half and each half was pull tested to determine the relative weld strength.
Results
After tensile testing, a clear relationship was observed between weld speed and strength, as expected. Most interesting was the fact that the maximum weld strength was observed at 4 mm/s and 6 mm/s which were modeled to be the initial melt formation rates in the part.
Another interesting result was that the toughness of the weld, as measured by elongation, followed the same general pattern as the weld strength, although the difference between weld speeds was not as distinct.
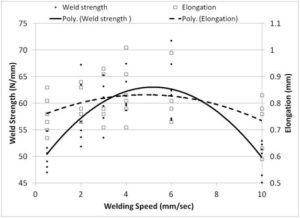 |
| Figure 5: Weld strength and elongation as a function of weld speed |
References
A. M. Knights. “Graphical Analysis Helps Find and Fix Ultrasonic Welding Problems” Plastics Technology. Sept 2005.
B. T. Kirkland. “Ultrasonic Welding: The Need for Speed Control” Plastics Decorating. July/August, 2012.
C. S. T. Flowers. “Servo-Driven Ultrasonic Welding of Biocomposites” ANTEC 2012.
D. A. Benatar. “Servo-Driven Ultrasonic welding of Semi-crystalline Thermoplastics” 39th Annual Symposium of the Ultrasonic Industry Association. Cambridge, MA. 2010.
E. M. Marcus, P. Golko, S. Lester, L. Klinstein. “Comparison of Servo-Driven Ultrasonic Welder to Standard Pneumatic Ultrasonic Welder” ANTEC 2009.
F. A. Mokhtarzadeh and A. Benatar. “Comparison of Servo and Pneumatic Ultrasonic Welding of HDPE Shear Joints” ANTEC 2011.


